About Onsightful
Transforming your climbing data into actionable insights
How It Works
Simple 3-step process to get your climbing insights
Get your URL
Go to your Mountain Project and copy the url that has your user-id and username
mountainproject.com/user/[user-id]/[username] Copy the URL to Onsightful
Onsightufl will automatically import your data
Get Your Dashboard
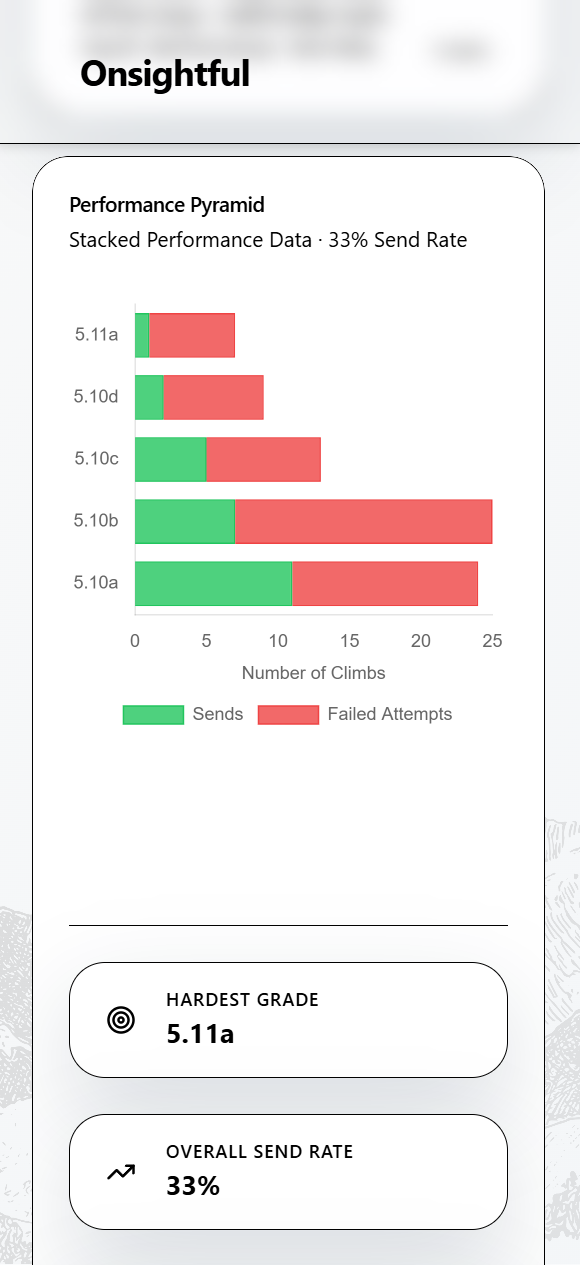
Performance pyramid, send-rate by grade, volume over time
Privacy: Your data is cached for 30 days and isn't stored permanently. No personal information is required.
Privacy & Data Security
Security Measures
- ✓ US-based servers: Data processed on secure US infrastructure
- ✓ No login required: We don't store your Mountain Project credentials
Data Policy
- • 30-day cache only: Your data is automatically deleted after 30 days
- • Performance optimization: Caching improves load times for returning users
- • No sharing: Your climbing data is never shared with third parties
- • Delete anytime: Contact us to remove your data immediately
What We DON'T Collect
No Mountain Project login required
Only your username and climbing data from your CSV
No cookies or behavioral analytics
Want your data deleted? Contact us anytime at [email protected]
Our Mission
Every climber deserves to understand their climbing journey. We transform raw Mountain Project data into meaningful insights that help climbers progress, train smarter, and achieve their goals through data-driven analysis.
What We Do
Onsightful turns your Mountain Project tick data into visualizations and actionable insights. We provide the tools to:
Track Your Progress
Visualize your climbing journey over time with detailed performance metrics
Identify Patterns
Discover your strengths, weaknesses, and optimal training zones through comprehensive analysis
Optimize Training
Make data-driven decisions about your climbing and training approach
Celebrate Achievements
See your peak performances, hardest sends, and climbing milestones
Real Examples
See Onsightful's comprehensive analytics in action with our dashboard views and detailed performance cards:
Performance Cards
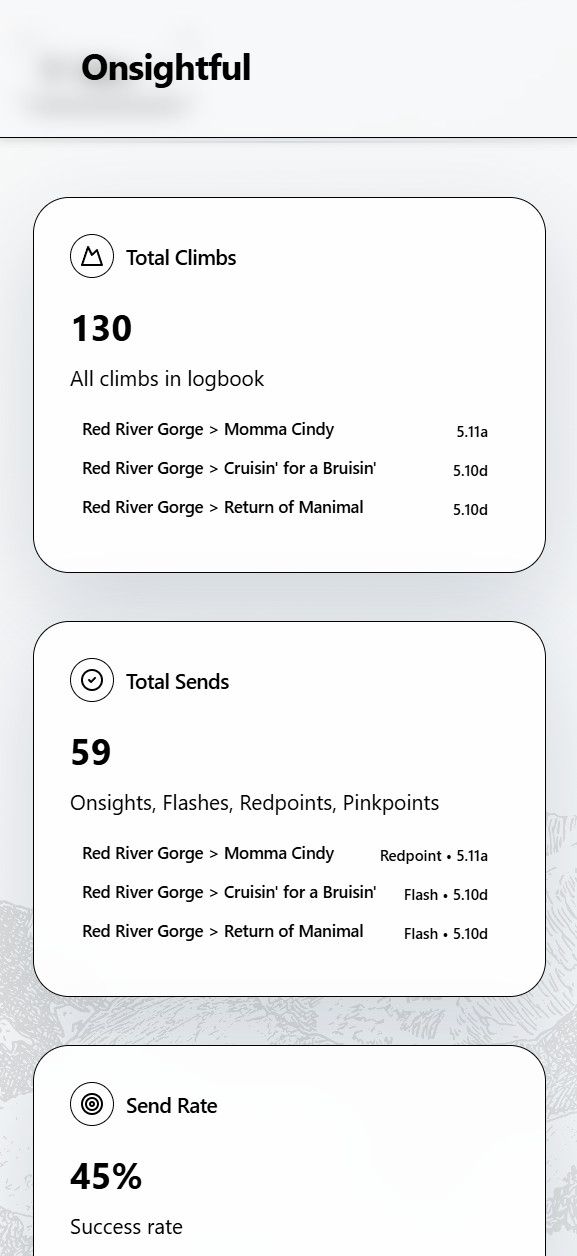
Key metrics at a glance: track your total climbs, successful sends, hardest achievements, and overall send rates.
Analytics Charts
Visualize your progress with grade distribution analysis and climbing activity trends over time.
Mountain Project vs Onsightful
We're not competing with Mountain Project — we're complementary tools that work better together
| Mountain Project | Onsightful |
|---|---|
| Route database & beta Comprehensive climbing route information and community beta | Analytics & insights Transform your tick data into performance visualizations |
| Logging your climbs Record and track what you've climbed with ratings | Understanding your data Statistical analysis of your climbing patterns and progress |
| Personal performance tracking Individual analytics focused on your climbing journey | |
| Training optimization Data-driven insights to help you build out your climbing pyramid |
Stronger Together
Use Mountain Project to log your climbs and find routes. Use Onsightful to understand your progress and optimize your training.
Our hope is that we grow stronger together in the climbing community.
Our Approach
Pulling Mountain Project Data
We value Mountain Project, as many climbers do, yet we wanted to dive deeper into the data. Mountain Project does not allow scraping of their website, however users are allowed to download their tick data! Simply go to your ticks page and click 'Export CSV'. This is how Onsightful accesses your Mountain Project tick data.
Note: We will not compete with Mountain Project — we provide completely different value. Mountain Project will be your logbook and crag guide, Onsightful will be your insights. Our hope is that we grow stronger together.
Data Processing
Our sophisticated grade normalization engine handles the messiest real-world data:
- YDS, V-Scale, and mixed grading systems
- Safety ratings: Complex formats with safety ratings (PG, R, X) are normalized for cleaner visualization. 5.10b R becomes 5.10b in charts.
- Grade ranges: Mixed grades like 5.10a/b are upgraded to the highest grade listed (5.10b).
- Historical data from years of climbing accurately processed
Comprehensive Analytics
We go beyond simple statistics to provide meaningful insights:
- Performance Pyramids: Visual representation of your sends vs attempts by grade
- Send Rate Analysis: Understanding your success patterns across different grades
- Volume Metrics: Track your climbing frequency and identify peak performance periods
- Efficiency Tracking: Measure improvement in redpoint vs onsight performance
Our Values
Data Accuracy
We prioritize accurate grade parsing and data processing. Our multi-layer validation ensures your analytics reflect your actual climbing performance.
Continuous Improvement
Climbing evolves, and so do we. We listen to users and add relevant features, improving our platform based on feedback and climbing community needs.
Frequently Asked Questions
I don't see my data.
You need confirm that your profile set to public, which is the default setting. To change your privacy to public, in Mountain Project, you need to go to Account Settings and then uncheck 'Private Tick List'. We apologize as we do not accept CSV uploads just yet, please contact us if you'd like us to prioritize this feature.
Do you store my data permanently?
No. Your data is cached, meaning stored temporarily, for 30 days to improve performance when you return, then automatically deleted.
My data looks wrong.
First, please confirm that it's correct in Mountain Project. If it's not then please correct the data there. Second, if it's correct in Mountain Project but incorrect in Onsightful, then please contact us! You can assess your your data here: (https://www.mountainproject.com/user/[user-id here]/[user-name here]/tick-export), common issues: - You forgot to log 'Style', meaning you did not log whether you lead, TR, Follow, Send, etc. the route or problem.
Some of Onsightful grades don't agree with Mountain Project.
To calculate some of the stats, we needed to normalize the grades with "/" and decided to default to the higher grade. For example, if you send a 5.10a/b, Onsightful will show a 5.10b. 5.10c/d becomes 5.10d, 5.12a/b becomes 5.12b, and so on.
What happens to protection ratings (PG, R, X)?
Safety ratings are normalized for cleaner visualizations by default. For example, "5.10b R" displays as "5.10b" in charts. This reduces visual clutter while maintaining grade accuracy for performance analysis.
Still Have Questions?
Contact us at [email protected] — we're climbers too and love talking about data!
Ready to explore your climbing data?
Copy your Mountain Project URL and discover insights about your climbing journey.
Copy Your URL with user id and user name →No login required • 30-day cache only • Secure & encrypted